The Team

Team members and key responsibilities

Shengyang Yin
Shengyang Yin
Algorithm Design & Core Development
Responsible for system architecture and machine learning–based trajectory processing, optimizing route smoothing and data efficiency.
Yize Zheng
Yize Zheng
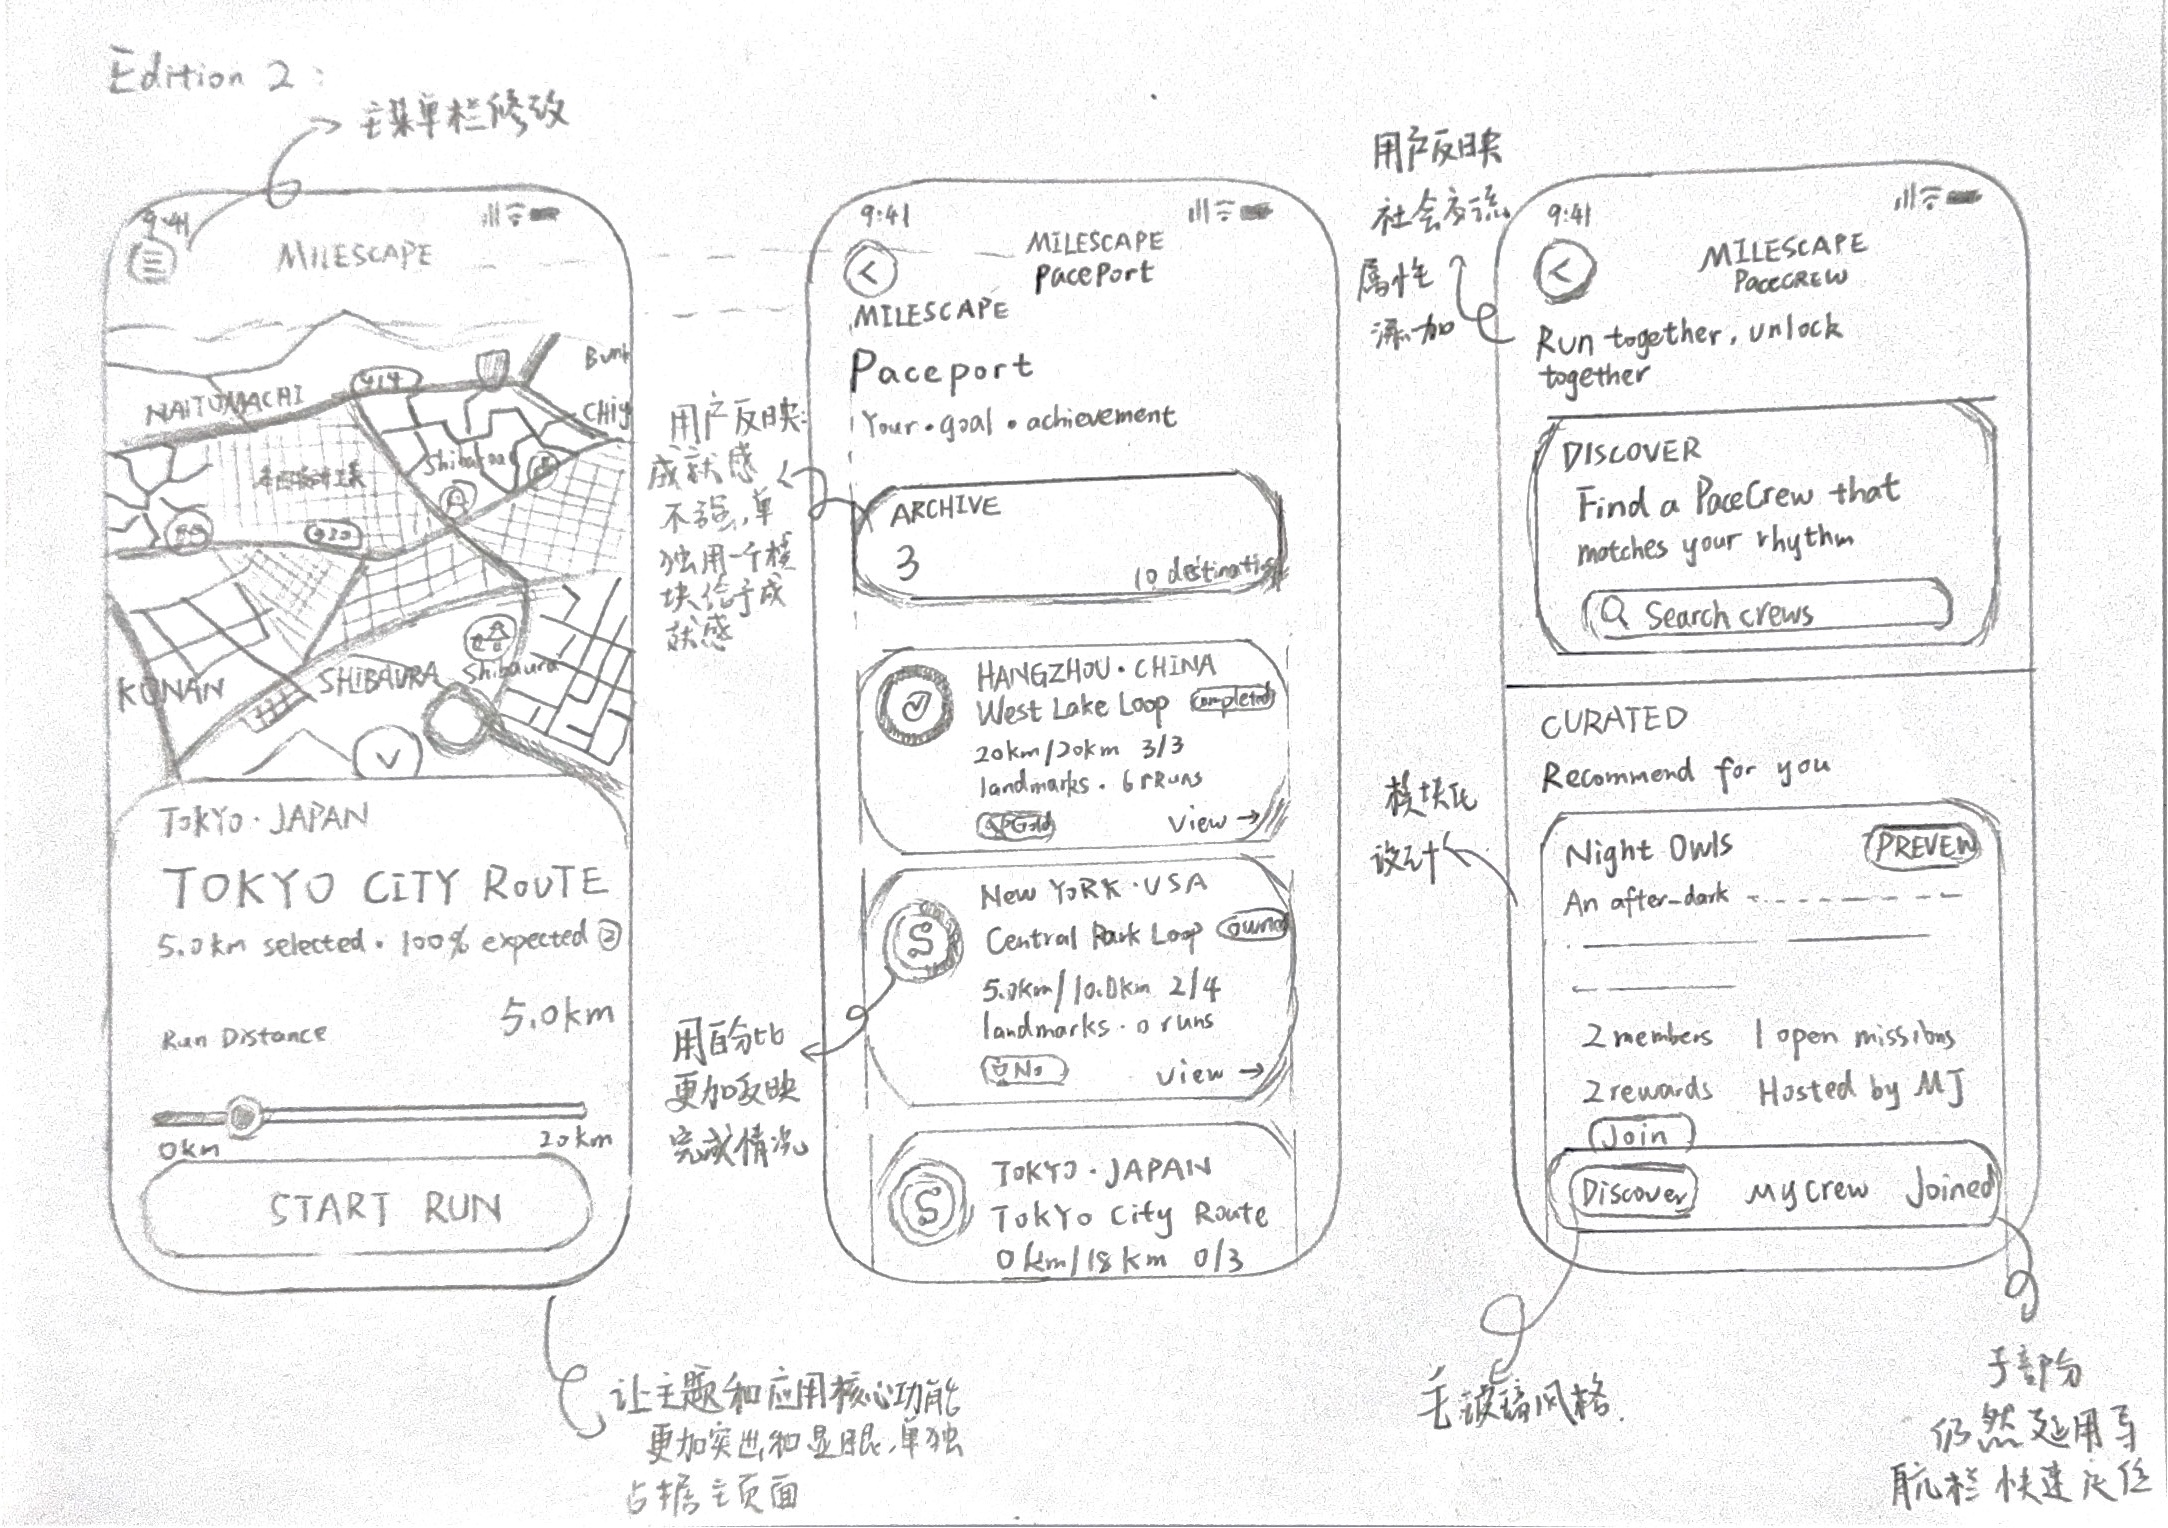
UI/UX & Interaction Design
Led the minimalist design language, crafting Morandi color systems and Apple-style smooth interaction experiences.
Chenrui Zhu
Chenrui Zhu
Mobile Architecture
Handled map API integration, sensor data processing, and background location stability optimization.
Qi Chen
Qi Chen
Product Strategy & Testing
Oversaw user journey design, conducted usability testing, and iterated based on user feedback.

Introduction & Motivation

Why MileScape is needed

In their daily exercise routines, runners require an app to help them plan their training schedules and provide support during workouts, driven by a desire for self-discipline and the ability to track their progress.

Existing fitness apps merely quantify running in terms of distance and duration, providing feedback in the form of figures such as calories burned or weekly summaries [1]. While such self-monitoring features are useful for basic activity tracking, they struggle to address the repetitive nature of running itself, making it difficult to maintain long-term motivation.

Research indicates that up to 42% of users lose interest in fitness trackers within six months [2]. This high attrition rate is partly due to saturation and redundancy in the information provided by fitness apps, as well as a lack of meaningful feedback and a sense of belonging [2][3].

Based on the above issues, our group has identified the following two research questions.

RQ1: How can playful and creative running applications enhance user engagement and sustain long-term interest in running activities?

RQ2: How can human-centered design principles enhance runners’ emotional engagement and overall user experience in running applications?

Research & The Gap

Positioning MileScape between academic research and existing commercial products

Market Analysis

Common Products in the Market

Existing running and fitness applications such as Keep, Nike Run Club, Strava, and Apple Fitness focus heavily on performance tracking and structured training.

Figure 1: Market Distribution Pie Chart

Example: Keep 45%

Market Issues (Runner Perspective)

Figure 2: Ranked Bar Chart of Market Problems

Problem Identification

Our group survey revealed that most existing running applications focus excessively on data—such as mileage and calories—while lacking fun and engaging elements.

Many users reported that these systems fail to provide fresh experiences or meaningful rewards, making it difficult to sustain long-term motivation.

Approximately half of the users mentioned that competitive ranking systems introduce stress rather than enjoyment.

Although social features can increase engagement, they often require continuous coordination by organizers and may not suit all users.

Figure 3: User Preference Radar Chart

User Requirements

To identify effective incentives, we examined users’ interests beyond running, including gaming and travel.

Users showed strong interest in exploration and collection mechanisms, such as unlocking items and discovering new places.

Therefore, MileScape integrates these two core elements to create a more engaging running experience.

Although blind-box mechanics were considered, they were ultimately rejected due to the difficulty of delivering meaningful surprise and value in a digital environment.

Organizer Insights

Although organizers represent only 30% of users, they strongly influence participation.

They reported that:

• Runner motivation declines quickly after initial enthusiasm

• Existing apps struggle to retain users

• Group coordination is time-consuming and difficult

These findings suggest the need for systems that reduce reliance on organizers while supporting intrinsic motivation.

Identified Gap

Current running apps focus on data tracking and competition, while lacking engagement, fun, and emotional rewards.

There is a clear gap between user expectations and existing solutions.

→ MileScape addresses this gap by combining exploration, collection, and emotional engagement into a unified running experience.

Target Personas

Primary and secondary users identified through research

Li Persona

Persona 1: Runner (Primary User)

Li, Consistent Runner · Market Size: 70%
“In team applications, those who run less know it's not their effort, while those who run more are more willing to post their statistics. I need a visual profile to make my off-season mileage feel meaningful.”
Demography:
Male | 21 years
Suzhou, China
Member of University Running Club
Half-marathoner / running 40-70km/month
Motivation:
Exploration ⭐⭐⭐⭐⭐
Achievement ⭐⭐⭐⭐
Competition ⭐
Background:
Li is a runner who insists on running a half marathon. During the competition season, his mileage reaches a peak of 70 kilometers per month, but drops to 40 kilometers per month during the off-season. He uses professional equipment (Apple Watch/Garmin), but feels that pure physiological data tracking is saturated and cannot provide psychological motivation during the long and lonely off-season running. He likes to establish his own visual profile of effort (such as tracking running shoe mileage), but actively avoids the intense ranking culture, which is often dominated by "naturally talented runners" and brings him peer pressure rather than fun.
Frustrations:
• Pure mechanical data (speed, maximum oxygen uptake) is no longer sufficient to maintain power during the off-season.
• Anxiety and frustration caused by comparing oneself to "naturally gifted runners" on the leaderboard.
• In existing team applications, simply aggregating team miles can make high performers feel unrewarded and beginners feel uninterested.
Goals:
• To maintain a stable running habit during the off-season without competitive pressure.
• To establish a long-term, satisfactory visual profile to document his running efforts.
Needs:
• Seamless data synchronization with his existing wearable devices.
• Visual progress feedback transforms repeated milestones into exploratory journeys.
• A collaborative team model that clearly divides individual contributions.
Niu Persona

Persona 2: Organizer (Secondary User)

Niu, Running Organizer · Market Size: 30 %
“I need a system that motivates the team so that I don't have to chase after everyone's screenshots every day.”
Demography:
Male | 21 years
Suzhou, China
Former High School Running Club President
Motivation:
Convenience ⭐⭐⭐⭐⭐
Team Bonding ⭐⭐⭐⭐
Social Status ⭐⭐⭐
Background:
Niu has extensive experience in managing student group activities. During his tenure as the president of the high school running club, he often organized group runs. However, in the first few weeks, he struggled to cope with the rapid decline in members' enthusiasm. He spent a lot of time manually tracking everyone's progress using WeChat and Excel, making group coordination a challenging task.
Frustrations:
• After the initial hype, team engagement and motivation rapidly declined.
• Heavy manual coordination (chasing screenshots on WeChat).
• The existing applications lack a common visual goal for a unified team.
Goals:
• To keep team members engaged and active in the long term.
• To cultivate a strong sense of community and belonging.
Needs:
• A centralized dashboard for automatic data aggregation.
• A low-cost coordination tool for organizing activities.
• Team based collective goals (e.g. relay tasks).

Design Solutions

How MileScape addresses motivation, playfulness, and human-centered running experience

Overall Aim

MileScape aims to turn running into a journey, not a task.

To design a playful, human-centered running experience that transforms repetitive physical activity into a meaningful, emotionally engaging journey, thereby improving long-term user motivation and engagement.

Inspiration

Adapt Forest's “accumulate focus → visualize as a tree” mechanism to the running context.

At the same time, consider that most existing apps focus on normative social comparisons (such as leaderboards), which may not suit users with a weaker competitive spirit or those pursuing mastery goals rather than performance goals [4].

Instead, adopt the concept of “accumulate running miles → collect stamps,” where stamps can be used to unlock collection items—landmarks.

Specific Objectives

1. RQ1 aims: Enhance Playfulness in Running
• Transform running from a data-driven activity into a goal-oriented exploration experience
• Reduce user drop-off by introducing progressive milestone rewards (landmark unlocking)

2. RQ2 aims: Foster Social and Emotional Connection
• Replace abstract metrics (distance, calories) with visually meaningful progress (global routes and landmark journeys)
• Provide emotional rewards (e.g., postcard-style landmark unlock moments)
• Enable users to form running groups and participate in shared challenges, fostering a sense of community and belonging
• Allow users to collect and share achievements, enhancing social interaction and long-term attachment to the platform

3. Iterative Minimalist User Experience Design
• Design a clean, distraction-free interface following minimalist principles
• Develop a wearable interface optimized for glanceability, focusing only on essential information (e.g., distance and heart rate)
• Prioritize simplicity not as a static design choice, but as an iterative process shaped by real user feedback.

Novel Design Concept

1. Replace traditional exercise-data dashboards with an exploration-based map experience. Through Mapbox route previews, destination detail pages, and landmark timelines, the project translates running outcomes into a sense of “moving forward in space.”

2. Replace traditional ranking-based motivation with landmark unlocking.

3. Transform scattered running sessions into long-term route progress.

4. Turn running routes into collectible destinations.

5. Allow users to repeat the same route and earn advanced achievements.

6. Reduce the burden of manual recording through wearable-device integration.

7. Use PaceCrew to shift group running from competition and ranking to collaborative exploration.

8. Directly connect social motivation with content unlocking, creating team-exclusive reward mechanisms.

Why This Experience Is Engaging or Human-Centric

MileScape has created an attractive and user-centered experience by transforming the repetitive action of running from simple digital tracking into an interactive journey full of exploration and discovery.

Firstly, the system turns running into an exploration-filled journey, guided by landmarks, thereby enhancing the users' intrinsic motivation.

Secondly, MileScape brings emotional value and a sense of belonging to users through meaningful rewards.

Thirdly, the design focuses on creating a sense of belonging and connection. Through features such as "PaceCrew", users can participate in team challenges and strive towards a common goal, thus transforming running from a personal activity into a socially significant one.

Finally, the system adopts a minimalist design style and an iterative design approach to ensure that the interaction operations remain simple and intuitive, while continuously optimizing based on user feedback.

Overall, the MileScape project provides effective solutions for our RQ1 and RQ2.

User Journey Map

1. Goal Setting
2. Landmark Selection
3. Running
4. Unlock & Share
5. Milestone Unlock
6. Sharing
Actions
Choose a small running goal (1km / 2km)
Quickly confirm and start running
Select a virtual route (e.g. West Lake / Central Park)
Browse landmarks along the route
Start running, system auto-tracks
Quickly check pace and distance
Finish run and sync progress
Unlock landmark and generate share card
Accumulate distance to unlock new landmarks
View collected landmarks
Generate running poster
Share to social platforms
Thoughts
Just a short run today, keep it easy.
A fun route will keep me motivated.
No need for too much data, just keep the pace.
Unlocked a new landmark, worth sharing.
Another one unlocked, feels rewarding.
This looks great, I should post it.
Emotions
😌 Easy Start
🤔 Anticipation
🏃 Focused
🙂 Satisfaction
🏆 Achievement
🎉 Share
Pain Points
Goals too big → easy to give up
No direction → boring runs
Too much data → distraction
Lack of achievement or sharing motivation
No long-term motivation system
Unattractive share content
Opportunities
Small goals to reduce entry barrier
Introduce virtual routes & landmarks
Minimal UI with core data only
Landmark unlock + aesthetic sharing cards
Landmark collection system
High-quality visual sharing content

Organizer Journey Map

Parallel to the runner journey, this map focuses on how an organizer creates a PaceCrew, launches missions, maintains participation, and closes the group lifecycle responsibly.

Actor & Scenario: A runner wants to organize a PaceCrew, launch shared missions, and keep members engaged through collaborative running challenges.
1. Create Crew
2. Launch First Mission
3. Manage Members
4. Operate Missions
5. Reward & Motivate
6. Dissolve or End
Actions
Create a new PaceCrew
Set up the crew identity and purpose
Publish the first team mission
Set a clear shared starting goal
Invite, approve, or manage members
Watch who joins and who stays active
Monitor mission participation
Adjust tasks to sustain crew activity
Maintain shared rewards and goals
Keep team motivation visible
End the crew when needed
Close the group in a clear, responsible way
Thoughts
I want to build a running community.
The crew needs a clear starting goal.
I need to keep members involved.
The crew should stay active over time.
Shared rewards make the team feel connected.
If it no longer works, I should close it properly.
Emotions
Initiative
Activated
Responsible
Focused
Encouraged
Resolved
Pain Points
Hard to start a group
Crew feels inactive at launch
Low member engagement
Difficult to sustain activity
Rewards may feel weak
Organizer cannot simply leave
Opportunities
Lower the barrier to forming a crew
Turn a static group into a shared challenge
Support belonging through team structure
Help organizers monitor and sustain participation
Strengthen motivation with collective rewards
Support responsible closure of the crew lifecycle

Ideation & Alternatives

Exploration of design ideas and decision-making process

Crazy Eights

Rapid ideation sketches exploring multiple UI directions and interaction concepts.

Sketch Flow

Keep one sketch in focus while the other sheets stay stacked behind it for a cleaner view.

1 / 3
Crazy Eights Sketch 1
Crazy Eights
Concept Sheet 01
Early layout directions exploring how route discovery, milestone rewards, and playful running feedback could live together in one flow.
Crazy Eights Sketch 2
Crazy Eights
Concept Sheet 02
Alternative compositions testing map-first navigation, progress reveal, and how reward moments could appear without overloading the screen.
Crazy Eights Sketch 3
Crazy Eights
Concept Sheet 03
Refined sketch directions comparing feature density, route storytelling, and landmark collection interactions across several product layouts.

Design Alternatives

Option 1: Data-driven Dashboard
Clear metrics and direct performance reading, but it lacks enough engagement to sustain curiosity over time.
Option 2: Gamified Rewards System
Creates stronger short-term motivation, but risks feeling superficial if rewards are disconnected from the running journey.
Option 3: Exploration-based Journey (Chosen)
Builds long-term engagement, emotional connection, and stronger alignment with what users actually wanted from the experience.

Low-Fi Prototype

Early wireframes and interaction flows tested through Figma prototype.

Low-Fi Prototype Screen 1 Low-Fi Prototype Screen 2 Low-Fi Prototype Screen 3

Technical Implementation

System design and development details

System Architecture

Overview of how the web application handles user data, map rendering, and interaction logic.

MileScape System Architecture Diagram

High-Fi Prototype

Interactive high-fidelity prototype screens presented with the same stacked page-flip browsing effect as the Crazy Eights sketches.

High-Fi Flow

Browse the polished mobile screens one by one while the next views stay layered behind the current page.

1 / 4
MileScape high-fidelity prototype start screen
High-Fi Prototype
Start Screen
Landing view introducing the route card interaction and the press-and-hold flip metaphor for exploration-based running.
MileScape high-fidelity route detail screen
High-Fi Prototype
Route Detail
Map-based route selection view showing progress setup, exploration framing, and the primary call to start the run.
MileScape high-fidelity run result screen
High-Fi Prototype
Run Result
Post-run summary with route context, earned rewards, and health metrics presented in a calm, polished dashboard.
MileScape high-fidelity collectible route card screen
High-Fi Prototype
Collectible Route Card
Shareable city card view combining destination imagery, collectible value, and the signature flip interaction for emotional reward.

Individual Contributions

Member Contribution
Shengyang Yin Algorithm & Backend Development
Yize Zheng UI/UX Design
Chenrui Zhu Mobile & System Integration
Qi Chen Product Strategy & Testing

Early Evaluation & Impact

How we evaluated MileScape in an early-stage user study

Evaluation Method

We conducted a small-scale comparative user study (n=7) to evaluate the user experience of MileScape and a mainstream fitness app (Keep).

A simplified version of the User Experience Questionnaire (UEQ-S) was used to assess usability and experience quality across 8 semantic differential scales, including ease of use, efficiency, clarity, excitement, and novelty.

Additionally, inspired by the Intrinsic Motivation Inventory (IMI), we incorporated measures of interest/enjoyment and perceived value to better capture users’ motivation and long-term engagement.

UEQ-S Snapshot

Figure 1: UEQ-S Item Square

IMI Snapshot

Figure 2: IMI Item Bar Chart

Key Findings

MileScape consistently achieved higher scores than Keep across multiple dimensions, particularly in enjoyment, motivation, and novelty.

Although MileScape falls slightly behind Keep in terms of supportiveness, the gap is minimal. This demonstrates that MileScape has achieved comparable functionality with simple data presentation and a clean interface.

IMI-based results further indicate that users found MileScape more engaging and meaningful, suggesting stronger intrinsic motivation and perceived long-term value.

User Feedback
“MileScape feels more engaging and meaningful.”
“Unlocking landmarks makes running more enjoyable.”

References & Acknowledgments

Academic sources and AI disclosure

AI Disclosure

AI-generated visual content used in this project is disclosed in the references below in accordance with university policy.

References

[1] Y. Bhargava and J. Nabi, "The opportunities, challenges and obligations of Fitness Data Analytics," Procedia Computer Science, vol. 167, pp. 1354–1362, 2020, doi: 10.1016/j.procs.2020.03.346.

[2] Natalie, "42 percent of users lose interest in fitness trackers after 6 months," Big Think, 2015. [Online]. Available: https://bigthink.com/ideafeed/users-lose-interest-in-fitness-trackers-after-6-months

[3] X. Yu and S. Wang, "Research on the Development Status, Problems and Countermeasures of Sports and Fitness APPs," Asian Journal of Social Pharmacy, vol. 20, no. 1, pp. 88–93, 2025.

[4] R. Rockmann and H. Gewald, "Individual fitness app use: The role of goal orientations and motivational affordances," in Proc. Americas Conf. on Information Systems (AMCIS), Cancun, Mexico, 2019. [Online]. Available: https://aisel.aisnet.org/amcis2019/healthcare_it/healthcare_it/3

[5] M. Schrepp, A. Hinderks, and J. Thomaschewski, "Design and Evaluation of a Short Version of the User Experience Questionnaire (UEQ-S)," International Journal of Interactive Multimedia and Artificial Intelligence, vol. 4, no. 6, pp. 103–108, 2017.

[6] Ryan, R. M. (1982). Control and information in the intrapersonal sphere: An extension of cognitive evaluation theory. Journal of Personality and Social Psychology, 43(3), 450–461.

[7] ByteDance Doubao, Seedream 4.5, accessed 5 April 2026. [Online]. Available: https://www.doubao.com. Applied to generate the conceptual hero image in the illustrative figure. Prompt: "Minimal abstract visualization of 70% runners and 30% organizers, contains two overlapping circles, clean Apple-style, flat design, soft shadows, no pie chart, no bar chart."